Varun Rajan, Noel Suarez
University of Wisconsin-Madison, Madison, WI
Abstract
This project explores how print parameters affect PLA Aero, a lightweight foaming filament used in Fused Filament Fabrication (FFF). PLA Aero reduces part density by expanding during printing, but its behavior is highly sensitive to temperature and flow rate. This often requires trial and error to tune. To address this, we printed nine identical airfoil samples under varying settings, recorded their mass and inspected print quality. The results were compiled into a laser-cut wood display with labeled parts and installed in the Design + Innovation Lab at UW–Madison. This hands-on visual guide allows users to compare the effects of different print settings and make informed decisions when using PLA Aero, helping reduce wasted time and material.
Introduction
PLA Aero is a lightweight, foaming 3D printing filament designed to reduce part density by expanding during extrusion. This characteristic makes it especially useful for applications where minimizing weight is critical, such as drone components, RC aircraft, or structural prototypes. Compared to standard PLA, PLA Aero can reduce part weight by up to 50%, offering significant advantages in material efficiency and performance [1]. However, this benefit comes with added complexity as its foaming behavior is highly sensitive to print parameters, particularly temperature and flow rate. Small adjustments to these variables can result in noticeable differences in part mass, surface finish, and overall print quality.
The foaming behavior makes it possible to reduce part density without changing the overall shape or dimensions of the print and is triggered by heat. At higher nozzle temperatures, a chemical blowing agent inside the filament causes the material to expand, allowing more volume to be filled with less plastic [2]. As temperature increases, the amount of expansion tends to increase as well, resulting in lighter parts [3]. Flow rate ratio also affects the outcome. That is the percentage of the normal extrusion rate used during printing, which controls how much material is deposited and influences how much PLA Aero can expand. Lower flow rates give the filament more room to expand, further reducing the amount of material used in the print [4]. However, these benefits come with trade-offs. Higher temperatures and lower flow rates can lead to print issues such as stringing, surface roughness, or weak structural areas. Learning how these settings interact is key to successfully using PLA Aero, especially in projects that require both weight savings and print reliability.
Despite its potential, PLA Aero remains under-documented in academic and hobbyist communities. Most available knowledge is anecdotal and shared through forums, maker blogs, or video tutorials. This leaves users to rely heavily on trial and error which often leads to wasted filaments, inconsistent results, and a steep learning curve for those new to the material. From our own experience working with PLA Aero, we observed that print settings, especially higher temperatures, can increase foaming, but often at the cost of print quality due to stringing or detail loss. Without clear references, they rely heavily on trial and error, which can lead to wasted filaments, inconsistent results, and missed opportunities to explore advanced materials. This project was driven by the need to support those users by making PLA Aero more approachable. By providing a clear, visual reference for how print settings impact weight and quality, we aimed to create a tool that helps students experiment with greater confidence and less frustration.
Project Goals
The main goal of this project was to help users at the UW–Madison Design + Innovation Lab better understand how PLA Aero responds to changes in print settings. Since the material is highly sensitive to temperature and flow rate, we wanted to test how those settings affect part weight and print quality. By running a controlled experiment and collecting measurable results, our goal was to create a clear, visual reference that others could learn from.
We chose to present our findings through a physical display that could be installed in the lab. It features nine mounted prints, each labeled with the print settings used and the final part weight. The display also includes a brief explanation of PLA Aero and a QR code linking additional data and slicer settings. Our goal was to reduce the trial-and-error process for future users and make working with PLA Aero more approachable through a hands-on, data-backed resource.
Design and Experimental Approach
Scanning Process
We began by selecting an airfoil geometry as our test part due to its relevance in weight-sensitive applications like drones and RC aircraft. The shape’s curved surface and relatively thin profile made it a good selection for visualizing how foaming affects dimensional accuracy and surface finish. To capture the geometry, we used a Creaform Handyscan 700 handheld 3D scanner to scan a physical airfoil model. This scanner provided a high-resolution mesh that preserved the fine details of the surface. The scanning setup and corresponding mesh are shown in Figures 1 and 2, respectively.
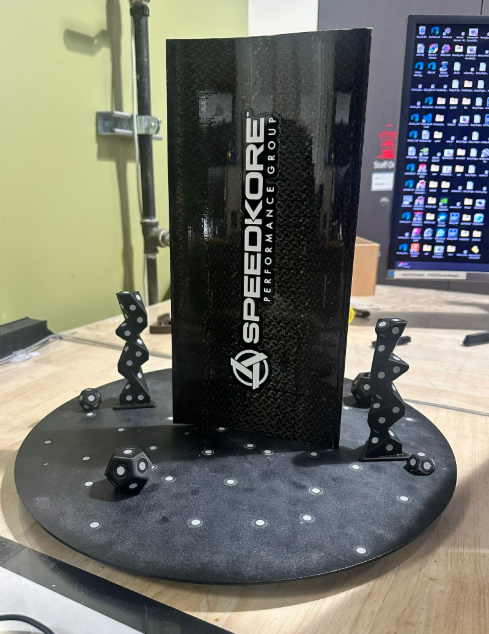
Figure 1: Creaform Handyscan 700 scanning setup
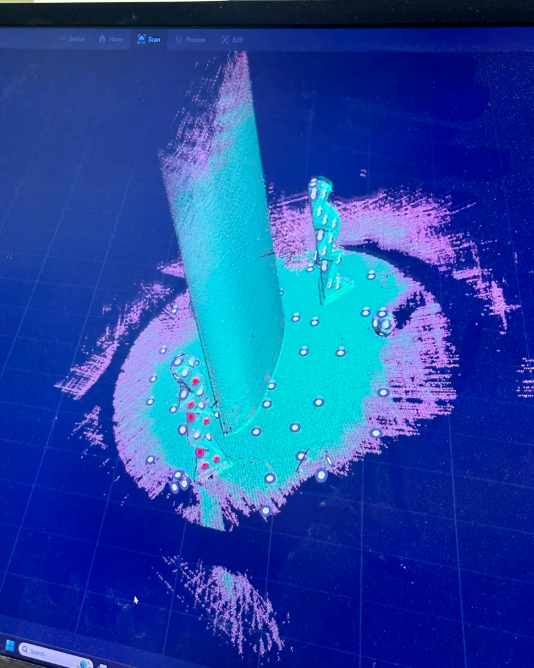
Figure 2: Mesh obtained from 3D scan
The scan data was imported into VX Elements, where Figure 3 shows the post-processed mesh by cleaning up surface noise, aligning the model, and removing artifacts.
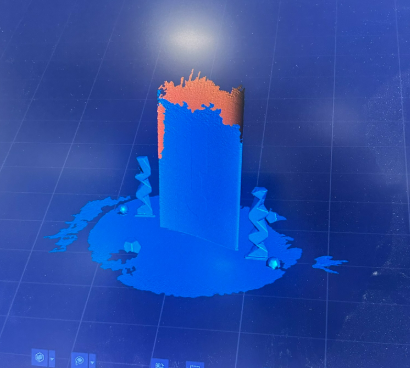
Figure 3: Post-processed model imported to VX Elements
Instead of using the full scanned airfoil, we sliced out a smaller section from the fully captured geometry to create a flush, cleanly bounded part that would be easier to print, mount, and compare across multiple configurations. This is shown in Figure 4.
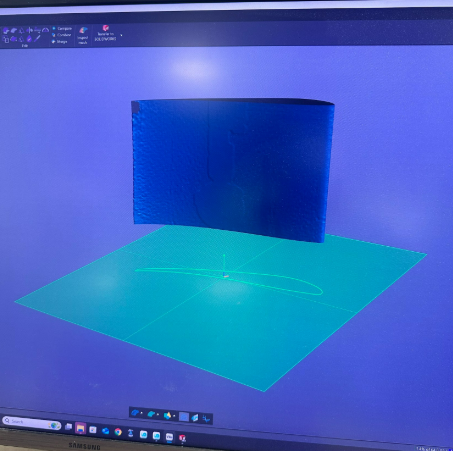
Figure 4: Airfoil subsection
This smaller section maintained the original curvature and detail of the airfoil but reduced print time and material use. Once the sliced geometry was finalized, we exported it to SolidWorks, where we converted it into a watertight, printable CAD model shown in Figure 5.
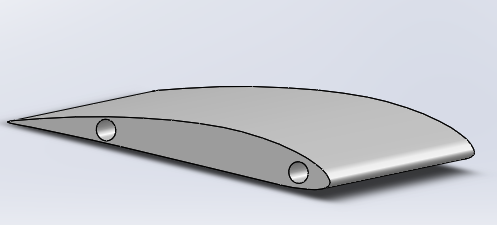
Figure 5: Airfoil exported to SolidWorks
This ensured that every sample would be dimensionally consistent and optimized for 3D printing on the Bambu Lab platform. The airfoil setup in Bambu Studio is shown in Figure 6.
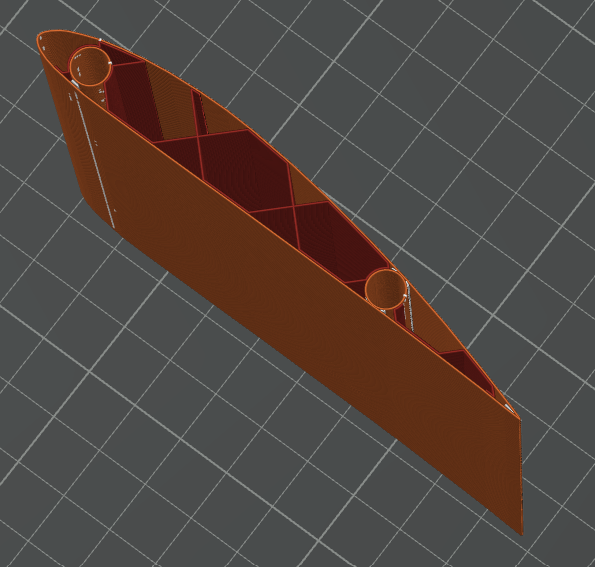
Figure 6: Airfoil setup in Bambu Studio
A test sample was printed with normal PLA before PLA Aero to get an idea of how large to make each of our configurations and ensure the part file was successful. This test print is shown in Figure 7.
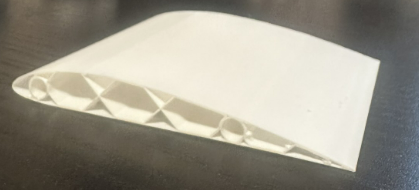
Figure 7: Test print made from PLA
With the part file proving to be successful, the nine different configurations could then be made.
Print Configurations
All nine of the samples were printed using PLA Aero filament on a Bambu Lab X1 Carbon printer. This printer was chosen for its reliable material handling, tight control over temperature, and consistent extrusion, which were important for minimizing variability during testing. We printed nine samples total, varying the flow rate and temperature across three levels each. The specific flow rate ratios used were 0.45, 0.60, and 0.90, and the nozzle temperatures tested were 225°C, 245°C, and 260°C. Initially, we tested flow rates as low as 0.30, but those parts consistently failed due to under-extrusion and structural instability. As a result, we adjusted our range to start at 0.45, which provided more reliable prints while still allowing visible foaming behavior.
For each configuration, all other slicer settings such as infill, speed, layer height, and cooling were held constant. Each part had to be printed on its own bed because PLA Aero’s foaming behavior is sensitive to airflow and heat distribution, which can vary when multiple parts are printed at once. With all parameters set, the nine configurations could be printed. The nine printed airfoils are shown in Figure 8.
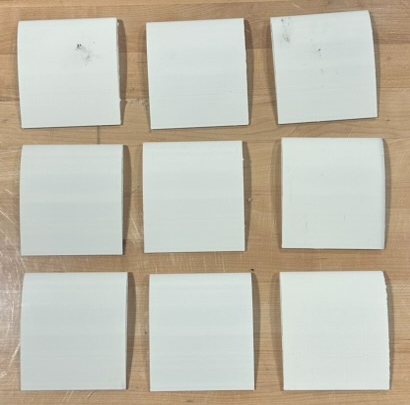
Figure 8: Nine printed airofils with different configurations
After each print, we recorded the mass of the part using a digital scale accurate to 0.01 grams. This weighing process is shown in Figure 9 and is used to compare the actual printed weight of the part to its theoretical sliced weight.
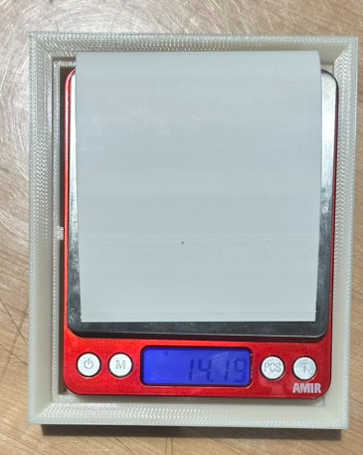
Figure 9: Part weighing process
In addition to taking the mass of each part, we evaluated surface finish by checking for signs of stringing, foaming irregularity, or dimensional warping. These results were documented for later comparison and display.
We also created custom 3D-printed mounts to hold each airfoil securely on the board while allowing them to be removed if needed. These brackets, shown in Figure 10, were designed to be low-profile and consistent across all nine samples
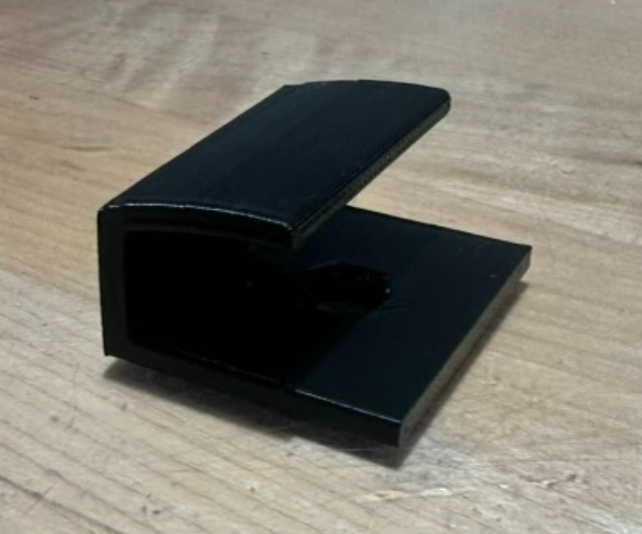
Figure 10: Mounting bracket to hold airfoil
With all components for the board finished, the actual board itself for the display could be constructed.
Building the Display
To present our findings in a useful and approachable way, we built a laser-cut wood display board that allowed all nine prints to be mounted side by side. We designed the board layout in Adobe Illustrator, carefully spacing each sample to make visual comparisons easy while leaving room for labels. The board layout is shown in Figure 11.
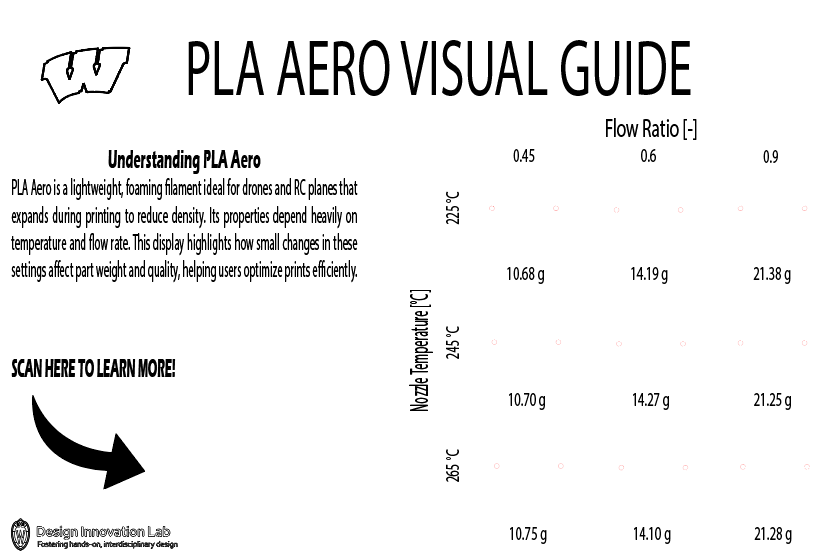
Figure 11: Board layout in Adobe Illustrator
Each sample was labeled with its final mass in its corresponding temperature and flow rate position, giving viewers an immediate understanding of how print settings affected performance. To give context, we included a short description of PLA Aero and its properties, along with a QR code that links additional information. This digital resource contains more useful information on the filament itself, a full tutorial on how to change the necessary slicer settings, print data, and .3mf files. This is shown in Appendix A. The board was designed to be compact, durable, and easily mountable, making it a long-term resource for users of the Design + Innovation Lab.
Results
After printing all nine configurations, we saw trends in how temperature and flow rate affected both part mass and print quality. For the most part, increasing the nozzle temperature and decreasing the flow rate led to a noticeable reduction in mass, confirming that these parameters promote greater foaming in PLA Aero. In some cases, mass still decreased at higher temperatures even when flow rate was relatively high, showing that temperature had a stronger influence on foaming and expansion than flow alone. Table 1 shows the full breakdown of measured mass for all nine print configurations across different temperature and flow rate settings.
Table 1: Measured mass (grams) for each configuration
| Flow Rate Ratio [-] | |||
| Temperature [C] | 0.45 | 0.6 | 0.9 |
| 225 | 10.68 | 14.19 | 21.38 |
| 245 | 10.70 | 14.27 | 21.25 |
| 260 | 10.75 | 14.10 | 21.28 |
The lightest part, printed at 225°C with a 0.45 flow rate, weighed just 10.68 grams. In contrast, the heaviest part printed at 225°C with a 0.90 flow rate came in at 21.38 grams, more than double the weight. This variation demonstrates how sensitive the material is to even modest parameter changes.
In terms of surface quality, higher flow rates and lower temperatures produced dense, smooth parts with minimal stringing or visual defects. These parts were more consistent and structurally sound but showed little of the intended foaming effect. As temperature increased, we observed progressively more stringing, rougher surfaces, and occasional signs of under-extrusion or curling, particularly at low flow rates. Parts printed at 260°C exhibited the most aggressive foaming, but also suffered from detail loss and fragile tips, especially near the trailing edge of the airfoil. Mid-range settings, especially 245°C at 0.60 flow rate, offered the best balance between weight reduction and acceptable surface finish.
In addition to collecting print data, the major outcome of this project was the completion of the physical display board now installed in the Design + Innovation Lab. The finished board presents all nine airfoil samples in a clear, grid-style layout organized by temperature and flow rate. Each sample is mounted using a custom 3D-printed bracket and labeled with its print settings and final mass. This structure allows users to directly compare parts and recognize how small changes in slicer settings affect both weight and print quality. Figure 12 shows the final display board with the mounted configurations
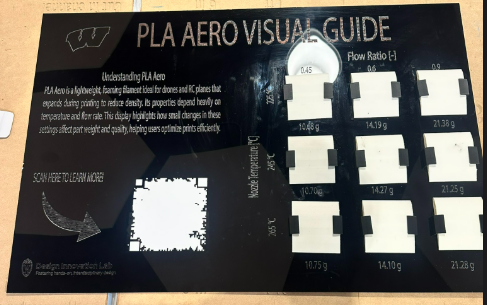
Figure 12: Final display board
What sets the board apart is the hands-on learning experience it provides. Students can inspect and even remove samples to get a closer look at the effects of foaming. By combining physical examples with digital resources, the board serves as a practical and accessible guide for users looking to explore lightweight printing without relying on trial and error.
Discussion
Our results confirmed that PLA Aero is highly sensitive to print settings. Higher temperatures and lower flow rates consistently produced lighter parts due to increased foaming, but also introduced issues like stringing, reduced detail, and fragile edges. On the other hand, denser prints made at lower temperatures and higher flow rates had smoother surfaces and better dimensional stability, but didn’t take full advantage of the material’s lightweight potential. The best balance between reduced weight and acceptable quality was found at mid-range settings, particularly around 245°C and 0.60 flow rate.
We encountered several challenges throughout the project that required iteration and adjustment. During scanning, the original airfoil was too large to print repeatedly, so we extracted a flush, manageable section in VX Elements and used that as our test piece. Printing also required trial and error as early prints showed issues like excessive stringing or under-extrusion, especially at high temperatures. Fine-tuning the slicer settings and organizing the print schedule helped us manage time and improve consistency.
The display design also went through several revisions. We experimented with different mounting options and adjusted the board layout to make sure it was compact, readable, and easy to assemble. In the end, we were able to create a clear and durable display that helps others quickly understand how PLA Aero behaves under different print conditions.
Conclusions
This project demonstrated how print settings—specifically temperature and flow rate—directly impact the weight and quality of PLA Aero prints. By testing nine configurations, we showed that lightweighting through foaming comes with trade-offs in print strength and surface finish. Mid-range settings offered the best balance of both.
The display board we created now serves as a lasting resource in the Design + Innovation Lab, giving students a clear, hands-on way to understand PLA Aero without relying on trial and error. By showing how print settings affect performance, the board makes this advanced material more approachable and accessible. It also supports future experimentation and prototyping at UW–Madison—whether by individual students, engineering teams, or campus design groups.
Acknowledgements
We would like to thank the UW–Madison Design + Innovation Lab for providing access to equipment, materials, and workspace throughout the project. We also thank Professor Xiao Kuang for his guidance, teaching, and support over the course of the semester, which helped shape this project.
References
[1] Bambu Lab, “PLA AERO,” Bambu Lab Official Store, [Online]. Available: https://us.store.bambulab.com/products/pla-aero.
[2] ColorFabb, “LW-PLA Technical Specifications,” ColorFabb B.V.,[Online].Available: https://colorfabb.com/lw-pla
[3] Sun et al., Journal of Cellular Plastics (2008); ASTM D792.
[4] Tuan D. Ngo, Alireza Kashani, Gabriele Imbalzano, Kate T.Q. Nguyen, David Hui,
Additive manufacturing (3D printing): A review of materials, methods, applications and challenges,
Composites Part B: Engineering,
Volume 143, 2018, Pages 172-196, ISSN 1359-8368,
https://doi.org/10.1016/j.compositesb.2018.02.012.
Appendices
Appendix A: QR Code contents
PLA AERO Parameter Reference – UW–Madison Design + Innovation Lab
PLA AERO is a lightweight, foamed PLA filament developed by Bambu Labs, designed for use in weight-sensitive applications like drones, RC planes, and prototyping. Its internal foaming agent activates around 220?°C, releasing gas that expands the filament during printing and significantly reduces density. By adjusting parameters like temperature and flow rate, users can fine-tune both the weight and surface quality of their parts, cutting weight by up to 50% without changing geometry.
Links:
How to set up files step by step:
https://wiki.bambulab.com/en/knowledge-sharing/studio-settings-for-rc-models
Bambu Labs website to purchase (includes filament information):
Downloadable Files:
Corresponds to configuration 5 on Visual Display (does not use spiral vase mode) – Double Click:
Step by Step on how to change printer parameters (with images) below.
Step by Step how to change Nozzle Flow Ratio and Temperatures:
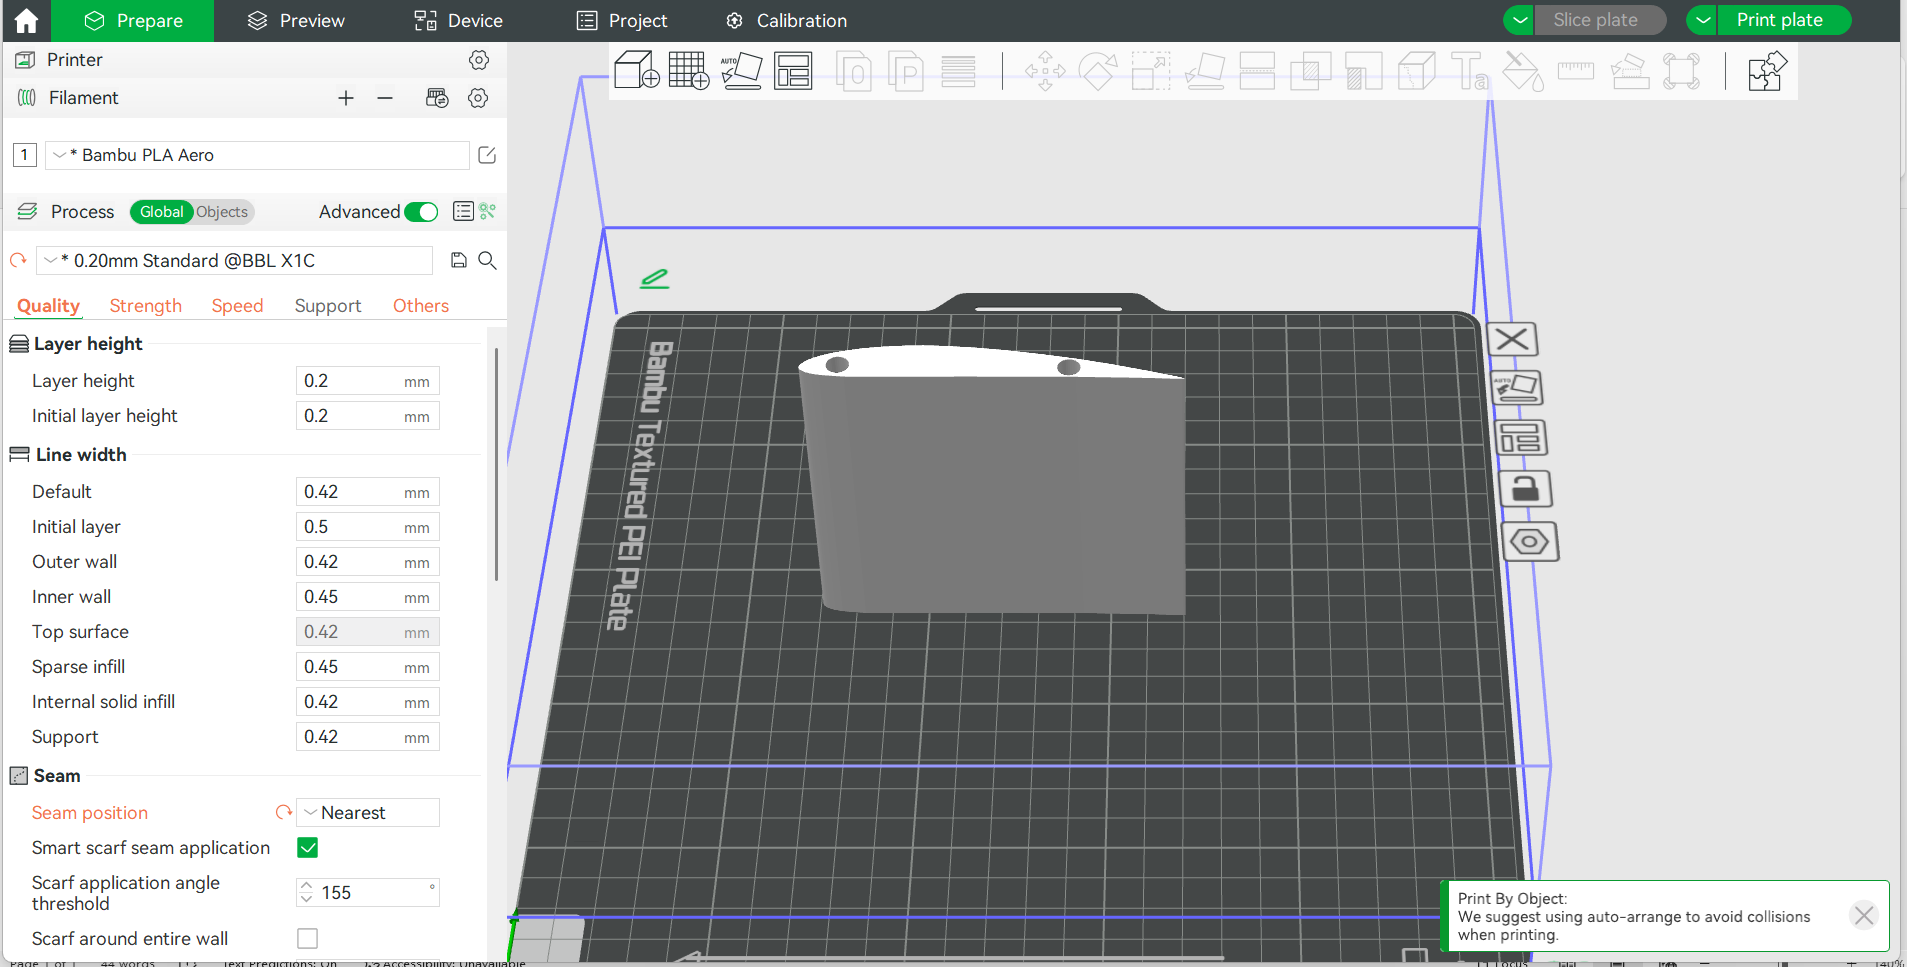
Step 1: Download File above and load/replace Airfoil as a stl
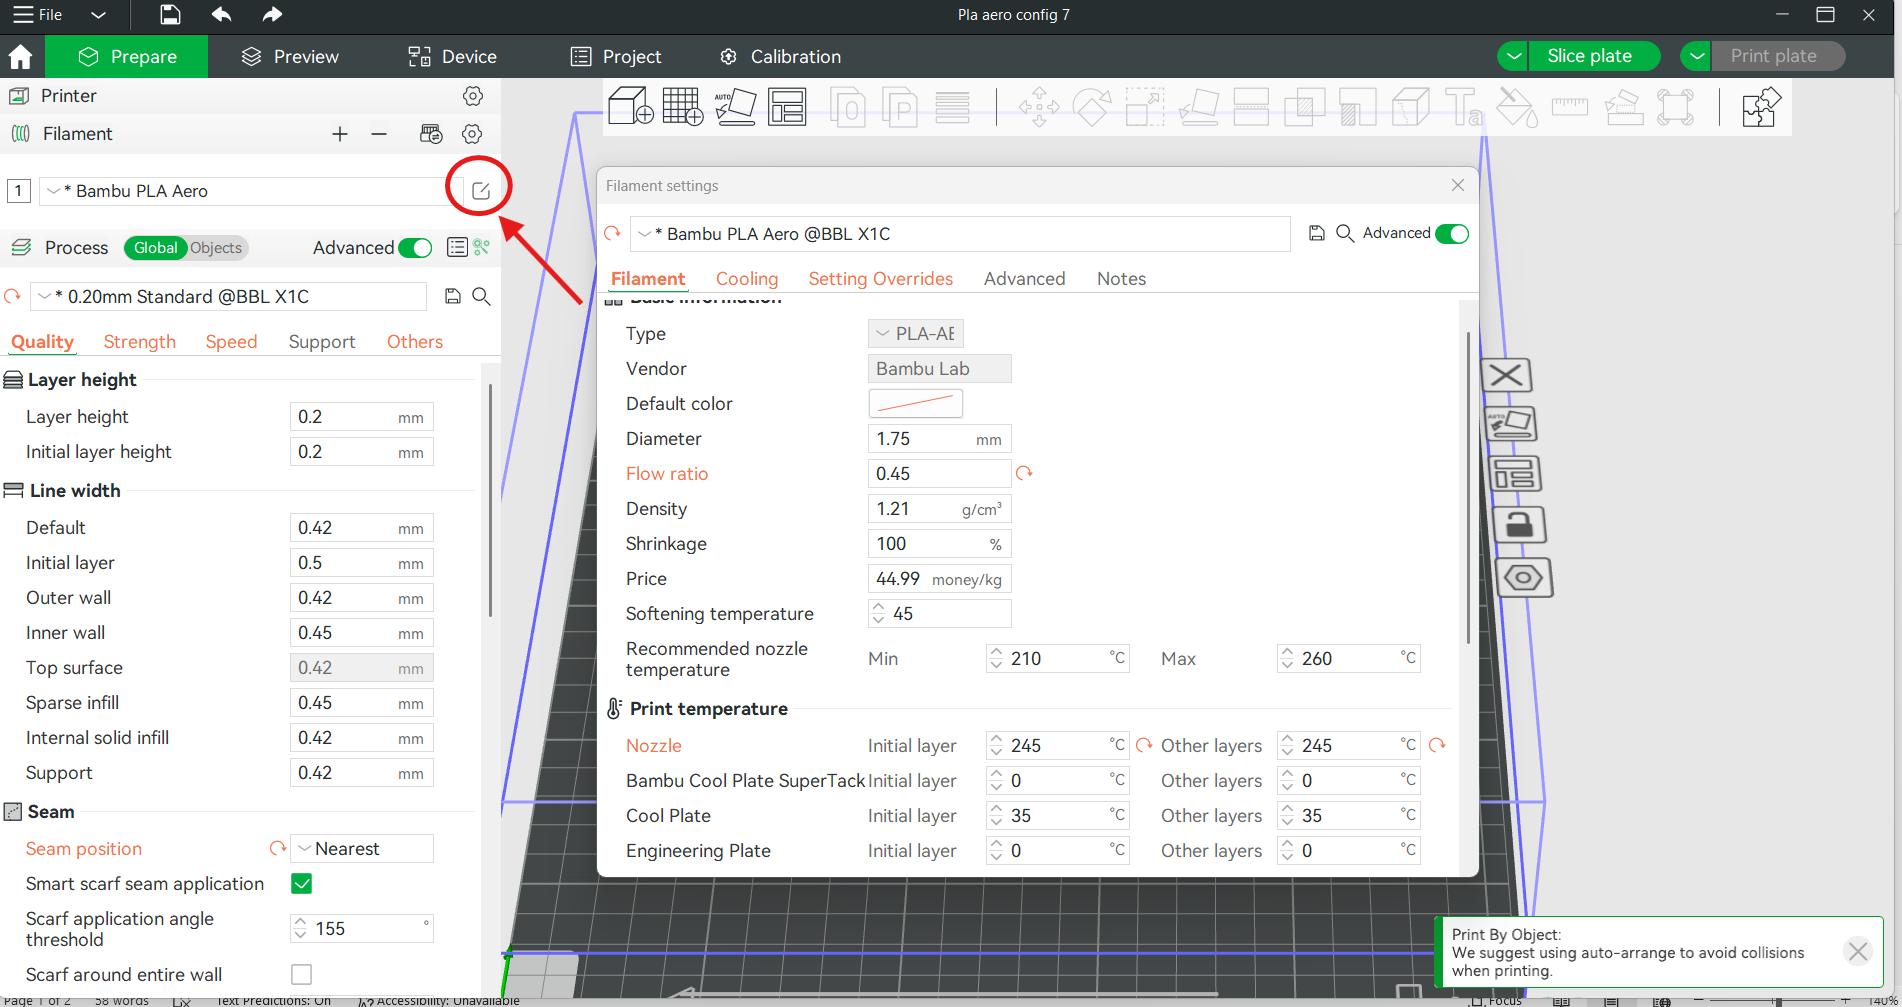
Step 2: Click the Edit Filament Preset button shown
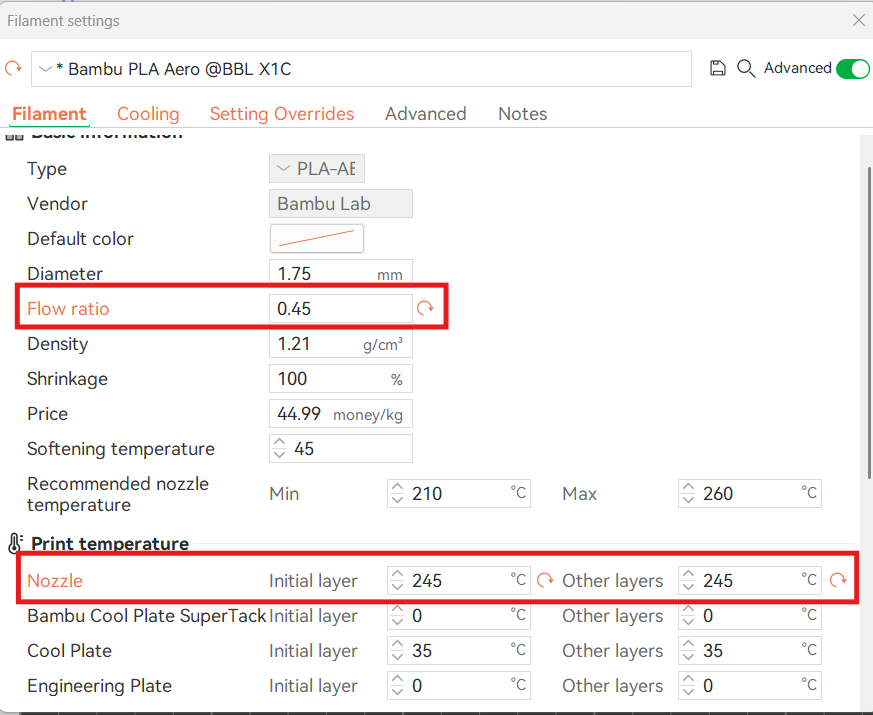
Step 3: Change Flow Ratio and/or BOTH nozzle temperatures (initial & other layers)