Project Overview
The purpose of our design is to enclose electronic components on a dog cart (wheelchair) that will be exposed to the weather. Thus, it will need to be watertight. It was known that SLA printed parts are watertight but the confidence in the water tightness of FFF prints was something to be considered. We printed three parts with the exact same geometry and altered the material used. The materials used were polylactic acid (PLA), polycarbonate (PC), and nylon. These three parts are shown in Figure 1. Following the results of a water tightness test, the optimization of the weight of the part could then be explored to minimize the added stress of the cart to the dog’s body by altering the part geometry. The goal of further optimizations would be to ensure mating is possible between the enclosure we are printing, and the base containing the circuitry (selected by the senior design group working on this project), as well as to ensure that the part retains its structural functionality following the weight and water tightness optimizations.
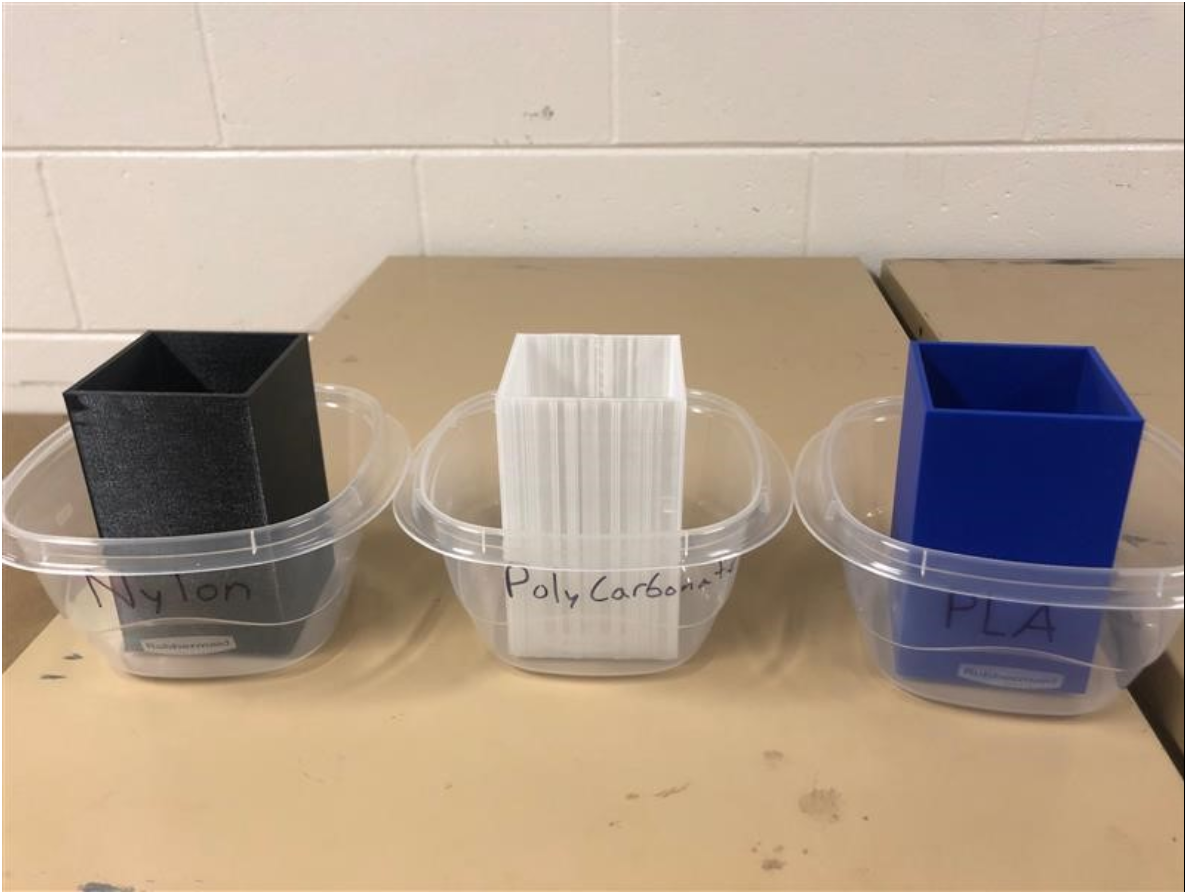
Figure 1: The three test parts printed for.
Test Part Printing
Since the application of the electronics cover is for a dog-cart electronics enclosure, a major consideration for our material selection and cover design is how the material used reacts with water. This is mainly dependent on how each layer in the part is bonded to the neighboring layers. Since cost is a factor in our design, we chose to test three low–cost materials, initially: polylactic acid (PLA), polycarbonate (PC), and nylon. Table 1 shows the price per gram of each chosen material when purchased from Makerspace as well as the price of other more expensive FFF materials.
Table 1: FFF printed materials chosen for testing and other options with their associated costs. Note that highlighted cells indicate low–cost materials chosen for testing.
| Material | Cost ($/g) |
| PLA | $0.08 |
| PC | $0.12 |
| Nylon | $0.12 |
| Polypropylene (PP) | $0.13 |
| Polyvinyl alcohol (PVA) | $0.19 |
To test how watertight each material was, we devised an experiment in which an identical part would be made from the three materials with the layer thickness and percent infill held constant at 0.15 mm and 20%. The parts printed were modified from the geometry of the final electronics cover to increase the hydrostatic pressure of water possible inside the part. Specifically, the electronics enclosure design shown in Figure 2 below was adjusted to the design shown on the three parts in Figure 3 which have dimensions of 2” x 2” x 3”, still with a thickness of 1/8”. Though the prices of the three parts vary slightly based on the cost per weight of the material and the material density, all the parts had a final cost of between $10 and $12.
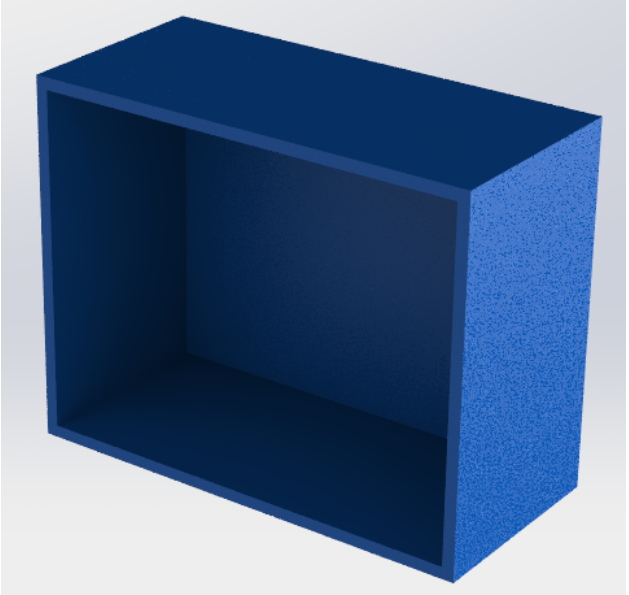
Figure 2: Actual design geometry for dog cart electronics enclosure
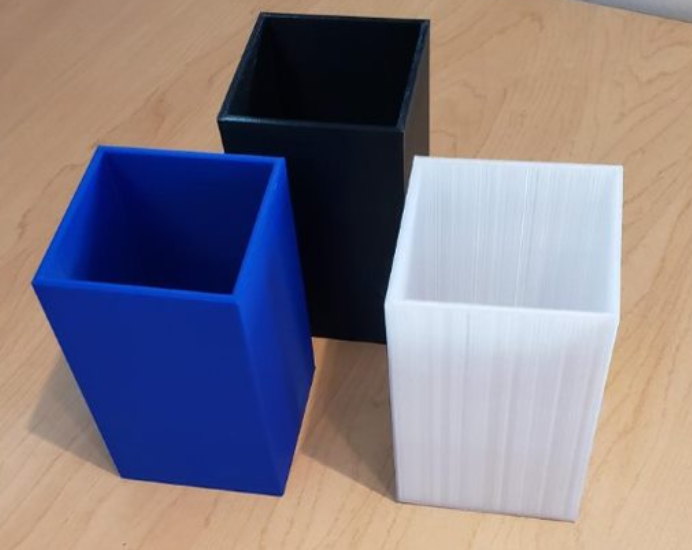
Figure 3: Modified parts printed for water absorbance and leakage testing.
After being printed at the Makerspace, the three test parts were evaluated for any errors or defects. We found that the PC part had several small cracks throughout the part, with one large crack present. We also noted that the PC part retained the support material under the base when printing was finished. According to Makerspace staff, it is difficult to remove the support material from the PC without the risk of breaking the glass printing platform since the PC bonds so tightly to the support material.
Originally, we planned to also print an SLA part with the same geometry to act as a control test part for our experiment. However, Makerspace staff informed us that the part would need to be printed at an angle to minimize the support material required. The orientation of the part recommended by Makerspace staff still required significant support material to be used. Because of this, the estimated price to print the SLA control part would have been $47.31. As a team, we felt that the information we could gain from having this part was not worth the high cost since we did not expect any leakage in the SLA part, and we mainly wanted to find a suitable alternative to SLA for the electronics enclosure.
Testing Procedure
Our initial testing procedure was rudimentary with a goal of differentiation to water tightness and physical properties of the three materials being tested. To do this efficiently we followed the same procedure for each part. First, we weighed each material to get the weight of the raw material and create a benchmark where we could compare final values and analyze the absorption of each material. We then weighed the part holder, which was a Tupperware container, that will be used to catch and house any water that leaks through the parts. To control the variables as much as possible we also filled each part with about 3.2 inches of water. That amount of water was chosen because we wanted to see the water-tightness of the raw material and there was a crack formed in the PC during printing at approximately 3.3 inches up the wall. Once each part was filled, we weighed the entire system together (the part, the Tupperware, and the water). This was to create a benchmark of the mass of the water used in each to compare the percentage of water that leaked through and absorbed into the part. These testing systems were then placed in a locker in the ECB building for approximately 20 hours. The testing environment is shown in Figure 4.

Figure 4: System testing environment
After the 20 hours were complete, we went back to the test setup and began analyzing the test results. To analyze the results completely we weighed the entire system for each part. We then removed the Tupperware and would have weighed the water that leaked out (although there was none). We then emptied the water from each part to analyze the absorption of each test part.
Results
When testing the three test parts there was not a large visual difference between the performance of each part. After 20 hours all water lines seemed to be close to the initial water line. Weight measurements were taken before and after to see if any water had left the system or was absorbed by the part, which can be seen in Table 2.
Table 2: Weight measurements throughout the experimental process.
| Material | Initial Empty Box Mass [g] | Final Empty Box Mass [g] | Mass absorbed [g] |
| PLA | 118.92 | 118.7 | -0.22 |
| PC | 147.75 | 147.9 | 0.15 |
| Nylon | 118.1 | 132.6 | 14.5 |
When comparing the initial weight to the weight after the experiment was run only the nylon had a weight change that was larger than the error of the team reading the scale. The nylon had absorbed 14.5 grams of water over the experiment. With this measurement, the team agreed that nylon would not be best suited for the desired application as the absorbed water could pass through the walls eventually and reach the electrical components. The PC was also discussed as a poor material for the application as even though there was no water leakage or absorbance, the PC is very brittle and had cracks in the test part. With PC being very brittle is will not fit well onto the electrical box as it needs to attach with a friction fit.
The experimentation and data acquisition process may have had several errors, altering the recorded results. Due to the test utilizing a triple beam balance (non-digital) with a precision of 0.1 grams, it would be difficult to identify more precise values of water loss or absorption. Unless the magnitude of the water mass transfer were on the scale of 0.1 gram or higher, the results could not be noted through this test. Furthermore, there may have been errors made by the experimenters in reading the scale across 2 separate days. Although the same scale was used, variation in the placement of the scale and the experimenter who calibrated and read the scale between trials may have resulted in inconsistent mass readings. Reading the scale also requires the experimenter to decide when the marker on the balance is in line with a marker on the base. Since this applied a combination of experimenter interpretation and the uncertainty of masses that fell between the precision of 0.1 grams, small errors may have been introduced to the recorded data.
Material Selection
The goal of our water absorption and leaking test was to allow us to decide which material we should move forward with for the electronics enclosure design. Cost is also an important factor in material selection, but the materials were chosen to be of comparably low cost, especially when compared to printing with SLA. Our test showed that PLA is the best choice based on its watertight properties since nylon experienced significant water absorbance during the experiment and the PC had cracks that would allow water to leak into the electronics enclosure. In addition, we feel it will be difficult to achieve a friction fit on the metal part with the PC part since it was so brittle when printed. Therefore, we have chosen to pursue PLA as the material we will use for the electronics enclosure.
Further Testing
With PLA selected as the material for the electronics enclosure, our focus for the remainder of the project will be to optimize our design for weight and an effective friction fit with the metal mating part. The limiting factors for optimizing the weight of the enclosure are water absorbance/leakage, part warpage, and part strength. Since we did not see any leakage or absorbance in the first test which tested a wall thickness of 1/8”, we plan to do further tests, decreasing wall thickness and percent infill until we reach a combination where the enclosure absorbs or leaks a significant amount of water. The parameters of the parts we will test are shown in Table 3 below. To potentially save printing time, test part E will be printed first. If part E meets the requirements outlined for the dog-cart application, we will revise our test parts to have wall thickness lower than 0.0675” and less than 10% infill to further optimize for weight.
Table 3: Testing parameter values for future test parts.
| Test Part | Wall Thickness | Percent Infill |
| A | 0.125” | 10% |
| B | 0.09375” | 20% |
| C | 0.09375” | 10% |
| D | 0.0675” | 20% |
| E | 0.0675” | 10% |
We can test part warpage by printing test parts, again with variable infill percentage and wall thickness, and observing how the part fits over the mating metal part. We would expect greater warpage in a thinner part or a part with a lower infill. This warpage could prevent the part from achieving a proper friction fit with the mating metal part.
The final factor we must consider is the strength of the cover. As the walls are made thinner and/or the infill percentage is decreased, the part will be more prone to a stress fracture. For the application of the part, we most expect this to occur due to the stresses induced by the friction fit. It is also possible that a thinner wall thickness will allow the part to deform more without fracturing when under stress in the friction fit.
By printing several parts with different wall thicknesses and percent infill, we can see how lightweight we can make the part while still preventing water absorption/leakage, significant warpage, or stress fractures due to the friction fit. While testing these parameters, we will also modify our design geometry to allow the case to withstand higher stress from the friction fit while optimizing for weight.