I. Print Design
A. Printed Part Description
After several rounds of brainstorming, the team developed the model shown below in Figures 1 and 2. This design has three main features: a phone bed, amplification cones, and a charging cord slot. The phone holding bed on the right hand side holds the phone horizontally with the phone speaker pointing towards the left hand side where the amplification cones are located. There is a channel that funnels the sound from the phone speaker through the cones where the sound is amplified. The charging cord slot sits behind the amplification cones. For the remainder of the update, the product will be referred to as the Amplifi3D design.
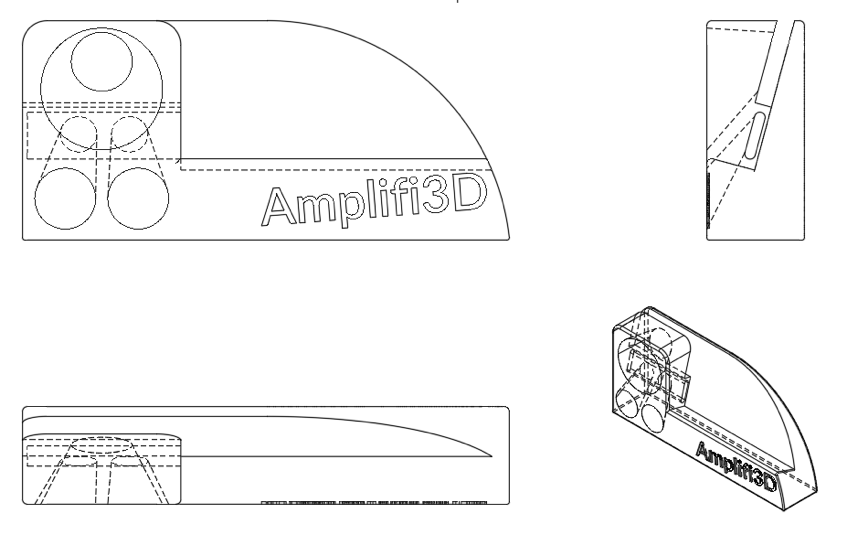
Figure 1: Part drawing for first print iteration of the Amplifi3D design.
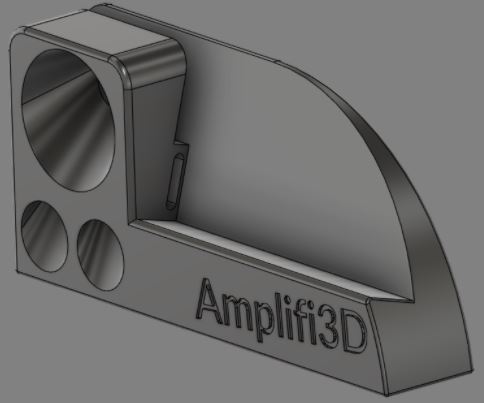
Figure 2: Part model of first print iteration of the Amplifi3D design.
B. Printed Part Specifications
The team printed the Amplifi3D design in Figures 1 and 2 using an FFF printer and polylactic acid (PLA) for the material. Figures of the printed part are found below in Figures 3-5. The selection for FFF printing was out of necessity more than choice; that is, the Amplifi3D design model chosen for the first print trial was too big for the SLA print bed. SLA was the first choice of printing process because Tough Resin and Rigid Resin both had the highest elastic moduli, and therefore would have the best acoustic quality of any material. However, the Amplifi3D design width is 200 mm and the Formlabs Form 3 bed size is only 185 mm (z-axis – maximum). The Ultimaker S5 that was used has a bed size of 330x240x300 mm, which was appropriate. With some of the proposed changes to the Amplifi3D design after this first print trial (talked about in the discussion section below), the team believes the print size can be kept under the maximum size for an SLA print on the second print trial.
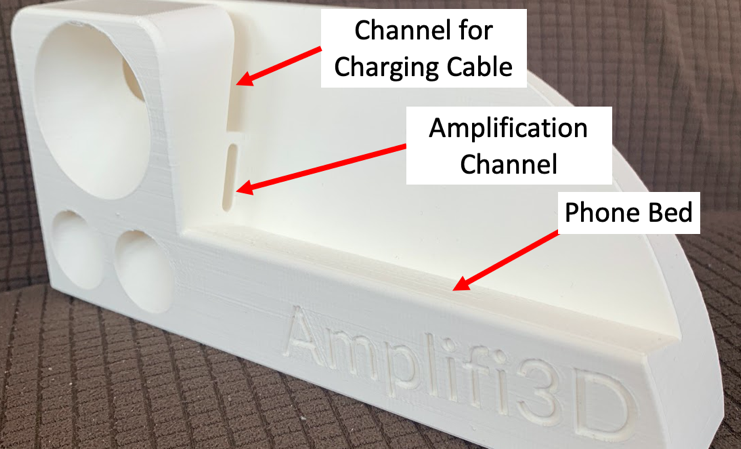
Figure 3: First print iteration of the Amplifi3D design (without supports). This right view shows the phone bed, the channel to the amplification cones, and where the charging cord enters from behind the cones.
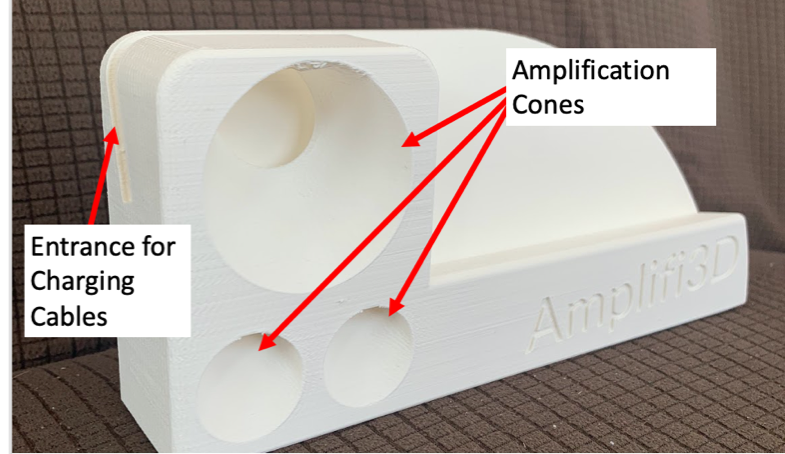
Figure 4: First print iteration of the Amplifi3D design (without supports). This left view shows the phone bed, amplification cones, and where the charging cord enters the speaker from the left.
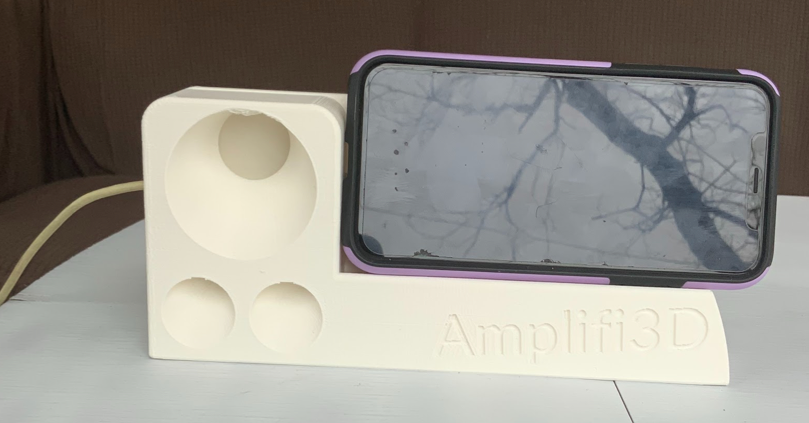
Figure 5: Phone placed on the first print iteration of the Amplifi3D design (without supports) with a charging cord.
A print time of 8 hrs 11 mins was achieved by using default speed settings in Ultimaker, no supports, and 10% infill. These settings worked well (justified in the testing and results sections), and would be kept the same if FFF were to be used again. 10% infill provided more than enough structural support to make the print solid and survive the drop tests.
Two prints of the same Amplifi3D design model were completed: one with supports shown in Figures 3-5, and one without highlighted in Figures 6 and 7. Because of the internal passages inherent to any passive phone amplification design, the team opted to print without supports. For the most part this worked out well, but some of the longer bridging sections, such as the top of the largest circular cut-out on the front face, displayed some issues with sagging filament extrusions across the gap. The print with supports solved this issue, but caused a few others: support material within the internal passages were very difficult to remove and support material on the embossed lettering was very difficult to remove, and in some cases impossible.
Solutions to these problems seem clear: design towards a goal of not having to use supports. This means only very short (~ <5mm) overhangs or gaps, and when possible, use curves when approaching bridging, as opposed to 90 degree angles.
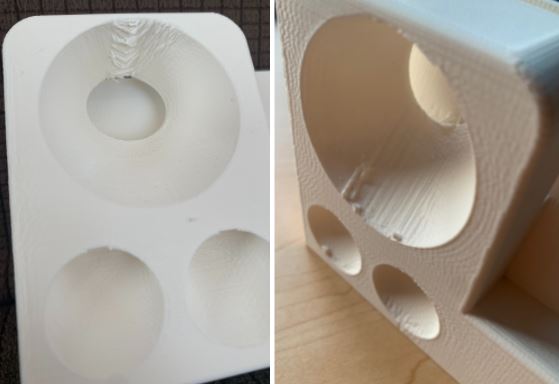
Figure 6: Zoomed-in view of the amplification cone defects in the first print iteration of the Amplifi3D design without supports (left) and with supports (right).
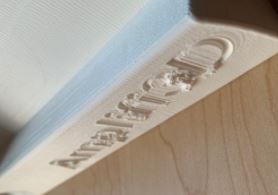
Figure 7: Example of additional print defects due to the use of supports.
II. Testing
A. Acoustic Amplification Test
Decibel measurements were made to asses acoustic amplification for the following four chosen audio devices:
- Built-in speakers on the Google Pixel 4a (baseline measurements)
- Amplifi3D Design
- Plastic Cup Amplifier
- Bose Micro Bluetooth Speaker
For consistency in testing, the same audio clip was used for all experiments. The audio clip used was a pure 432 Hz note played continuously such that the measured decibel level was a function of the amplification and not the changing frequency of the audio clip itself. The decibel level was recorded over a 10 second interval and the average dB over this time period was used as the metric.
An iphone 12 Pro with the iOS “Decibel X” application open was placed 1 foot in front of each of the audio devices to take the decibel level measurements as shown in Figures 8 and 9.
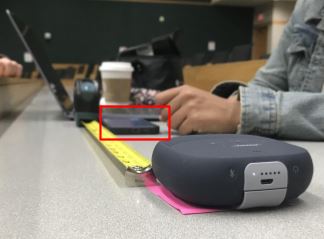
Figure 8: Closeup of the iPhone 12 Pro (red box) making decibel measurements at a distance of 1ft from the Bose Micro Bluetooth speaker.
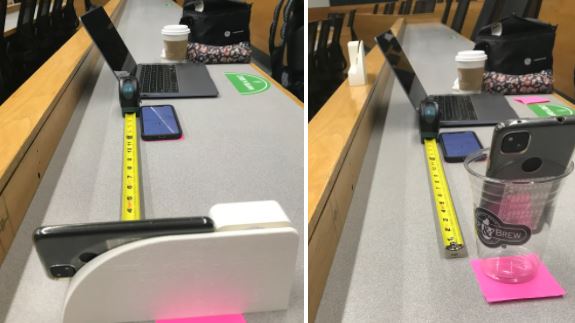
Figure 9: The testing setup showing the Amplifi3D design (left) and a plastic cup (right), both undergoing decibel testing at a distance of 1ft. Pink Sticky notes mark off the 1 foot distance.
The chosen metric for quality of acoustic amplification was “percent relative amplification.” This is calculated as the % increase in dB from the baseline decibel measurement (just the built-in phone speaker on the Google Pixel). Measurements were recorded at 25%, 50%, and 100% of the volume range of the phone’s built-in speaker.
B. Acoustic Quality Test
The acoustic quality measurements consisted of each group member listening to a pure 432 Hz note played continuously through each of the following configurations: the Google Pixel built-in speaker only, the Google Pixel placed inside a plastic cup, the Google Pixel paired to a Bose Micro bluetooth speaker, and the Google Pixel placed in the Amplifi3D design. They then rated the acoustic quality of each configuration on a scale from 1 to 10.
C. Print Quality & Design Aesthetics
The print quality/design aesthetics measurements consisted of each group member holding the Amplifi3D design (printed with support material) and inspecting its appearance and other practical criteria. They then rated each criteria, shown in Figure 10 below, on a scale from 1 to 10.
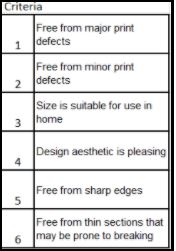
Figure 10: List of criteria used to evaluate the print quality and aesthetics of the Amplifi3D design.
D. Usability Test
The usability test measured how easy it was to use a phone with the Amplifi3D design by measuring three criteria: how securely the Amplifi3D design held the phone, how easy it was to insert and remove the phone, and how easy it was to use the charging cable with the Amplifi3D design. The Amplifi3D design is for the most popular iPhone and Android smartphones and does not encompass all of the possible smartphone models available. The phones considered in this design needed to rest easily while using the Amplifi3D design. They also needed to be easily inserted and removed from the resting area on the Amplifi3D design. Lastly, to ensure that the charger is a functional aspect, the phone needed to be charged easily without hassle with cables. The test was performed by ranking the qualitative values of these three criteria on a quantitative scale and the results are summarized in the following section.
E. Drop Test
The Amplifi3D design must be able to withstand impacts such as that which would be experienced when dropping the item from an average height table (4 ft). Therefore, a drop test was performed where the Amplifi3D design was dropped from a height of 4 feet onto hardwood flooring repeatedly, and observations were recorded.
III. Results
A. Acoustic Amplification Testing Results
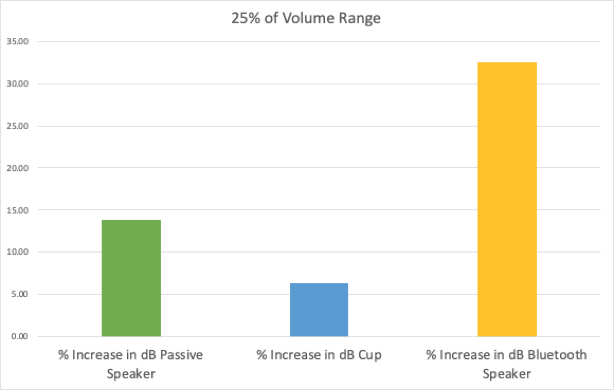
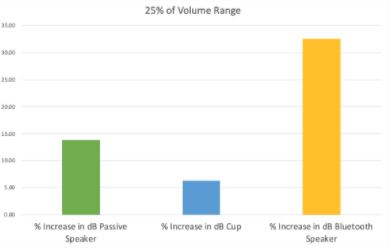
Across all volume ranges (25%, 50% and 100%), the Bose Micro Bluetooth Speaker was the loudest, as shown in Table 1, and Figures 11-13 below. This is expected, as out of all the audio devices tested, it was the only powered amplification device. At 25 % volume, the Amplifi3D design amplified sound better than the plastic cup. However, at the 50% and 100% volume ranges, the Amplifi3D design amplified sound less than the plastic cup.
Despite the fact that the Amplifi3D design did not outperform the plastic cup at the 50% and 100% volumes, it still appreciably amplified the phone’s built-in speaker. For the 25%, 50%, and 100% measurements, the Amplifi3D design had increased the measured dB by 5 dB, 1.8 dB, and 2.9 dB respectively. Note that acoustic amplification is not the only metric on which the performance of the Amplifi3D design is determined. Ways to improve the acoustic amplification performance of the Amplifi3D design will be addressed in the discussion section.
Table 1: Data recorded during acoustic amplification testing. The audio device used was a Google Pixel 4a, and the decibel reading location was in front of the audio amplification device.
| Vol. Level | Baseline Measurements (dB) | Amplifi3D Design (dB) | Cup (dB) | Bluetooth Speaker (dB) | % Increase in dB Amplifi3D design | % Increase in dB Cup | % Increase in dB Bluetooth Speaker | |
| 25% | 36 | 41 | 38.3 | 47.7 | 13.89 | 6.39 | 32.50 | |
| 50% | 44.5 | 46.3 | 48.9 | 65.5 | 4.04 | 9.89 | 47.19 | |
| 100% | 69.7 | 72.6 | 73.1 | 91.5 | 4.16 | 4.88 | 31.28 |
Figure 11: For the 25% volume range, the Amplifi3D design amplified sound better than the plastic cup, but not as well as the bluetooth Bose speaker.
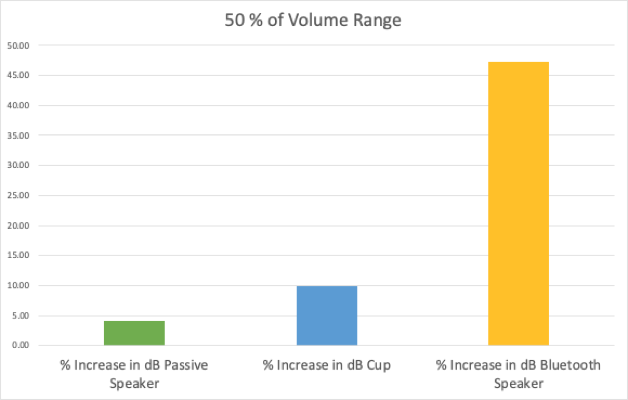
Figure 12: For the 50% volume range, the Amplifi3D design amplified sound less effectively than both the plastic cup and the bluetooth Bose speaker.
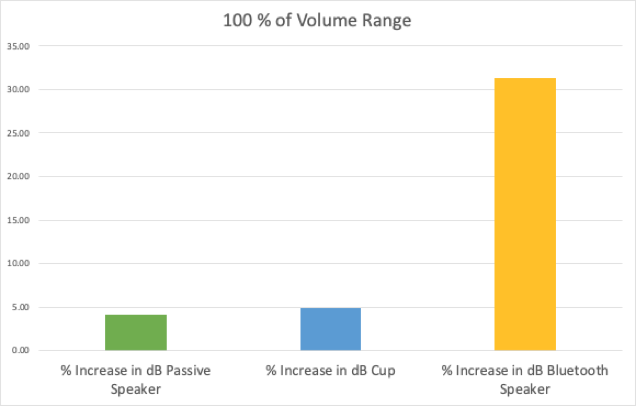
Figure 13: For the 100% volume range, the Amplifi3D design amplified sound less effectively than both the plastic cup and the bluetooth Bose speaker.
B. Acoustic Quality Testing Results
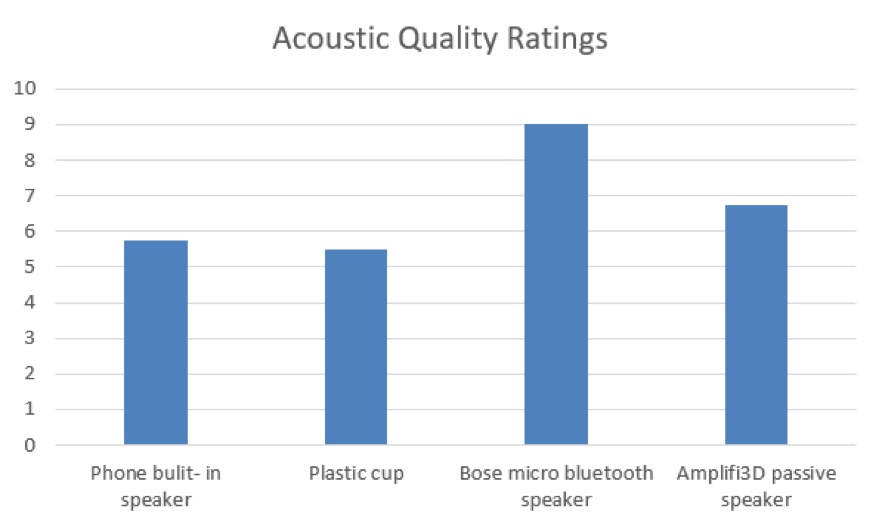
Figure 14: Results of Acoustic Quality Measurements. Each group member rated the acoustic quality of each device respectively on a scale from 1 to 10. The results were averaged and are presented here.
From the graph above in Figure 14, it can be seen that the Bose Micro bluetooth speaker performed the best in terms of acoustic quality, with the Amplifi3D design being the second highest rated acoustic quality with an average score of 2.25 less than the bluetooth speaker. Although the plastic cup was able to amplify more than the Amplifi3D design (see above results), it performed more poorly in terms of acoustic quality.
C. Print Quality & Design Aesthetics Results
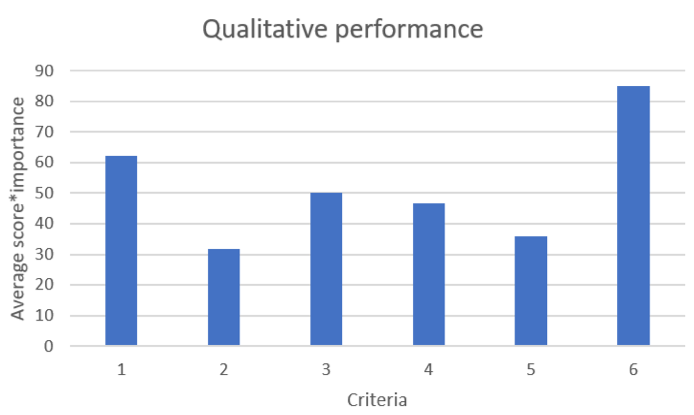
Figure 15: Qualitative performance of the Amplifi3D design based on the following criteria: 1. Free from major print defects 2. Free from minor print defects 3. Size is suitable for use in home 4. Design aesthetic is pleasing 5. Free from sharp edges 6. Free from thin sections that may be prone to breaking. Each individual’s (score* importance) is plotted against the criteria number.
From the graph in Figure 15 above, the Amplifi3D design performed the best in criteria 6 (free from thin sections that may be prone to breaking) and criteria 1 (free from major print defects). It can make the most improvement on criteria 2 (free from minor defects). Thus, the first Amplifi3D design was structurally sound, and the FFF print was mostly successful with minor cosmetic defects resulting from printing with supports.
D. Usability Testing Results
As shown in Table 2 below, the Amplifi3D design made it easy to put the phone into and remove from the amplifier, the phone was held somewhat securely, and the charging cable was somewhat difficult to use with the amplifier. “How securely the phone is held/stays in place” received a moderate score because the phone can easily fall out if the amplifier is moved. The charging cable criteria received a lower score because it does not line up with the charging port of the phone when inserted in the Amplifi3D design.
Table 2: The results of the usability testing for the Amplifi3D design based on the average team member’s rankings of each of the three criteria.
|
Criteria |
Average Rank 1-10 |
|
How securely the phone is held/stays in place |
7 |
|
Ease of phone insertion and removal |
9 |
|
Ease of using charging cable while phone is installed |
4.5 |
E. Drop Testing Results
Drop testing results, shown in Table 3, show that the Amplifi3D design was able to withstand multiple drops without any structural damage, scratches or dents.
Table 3: Summary of results and observations made during drop testing.
|
Criteria |
Yes (Y) or No (N) |
Comments |
|
Survived 4ft drop (Structural) |
Y |
If a phone was placed on the Amplifi3D design during use and the speaker fell, the phone would not be secure. The phone could be damaged. |
|
Free from major dents @ 4 ft drop (Aesthetics) |
Y |
No scratches or dents were observed that would negatively affect the aesthetics. |
|
Survived Repeated Drop Tests (5x) |
Y |
After drop testing several times, there appeared to be no structural or aesthetic damage to the Amplifi3D design. |
F. Results Summary
From the five different tests described above, it was determined that the first print iteration of the 3D printed passive phone amplifier successfully passed most of the testing criterion, but definitely has room for improvement.
Testing showed that the Amplifi3D design was able to amplify the phone’s sound at the 25%, 50% and 100% volume ranges while retaining roughly 75% of the acoustic quality compared to a bluetooth speaker, was structurally sound, had only minor print defects, and successfully passed the drop test without damage. Though both its amplification level and acoustic quality performed more poorly than the bluetooth speaker, the passive amplifier outperformed the plastic cup and phone speaker in sound quality. Inserting the phone was easy, but the configurations for holding the phone in place and charging the device had room for improvement.
It should also be noted that the product testing methods for acoustic amplification were slightly updated from the project proposal. In the original product testing plan, the team described creating a 3×3 grid of squares with side lengths of 1 foot, placing the audio/ amplification device in the center and measuring the decibel level from each of the 8 perimeter boxes. Taking measurements in this manner would have enabled a “surround sound” measurement averaged across all sections. However, it became apparent that there was not an appreciable difference in the dB measured at the different section locations (1-9). This is thought to be a function of the sensitivity limitations of the decibel meter used, the iOS app, “Decibel X” and the actual distance (1ft) at which the decibel level was measured. Additionally, it was stated in the project proposal that one of the tested devices was going to be headphones. However, the team decided against testing this, as headphones have a completely different acoustic quality and amplification method compared to other speaker devices similar to the project.
IV. Discussion
A. Assessment of Goals & Further Testing Needed
The first print trial of the Amplifi3D design met the team’s goals for the project to a moderate degree. The current print amplified the sound up to 5 dB, but the team’s goal is 10 dB, so this can be improved upon. However, the Amplifi3D design did a solid job of retaining sound quality, so this should be maintained. Additionally, the print worked with all phone models tested, but could do a better job with the ease of placing, removing, and charging the phone. The print also met the goals of surviving falls up to 4 feet and met the 8 hour print time requirement, so these should also be maintained.
Additional testing needs to be done with future iterations to evaluate the comparative functionality of the device indoors vs outdoors, how well the amplifier stays in place, and the longevity of the amplifier’s functionality as these are also goals the team has identified for the project.
B. Redesign Considerations
The results of this first print have inspired several redesign considerations for the team’s next iterations. These include adjusting the sound flow path, changing the orientation of the phone, and making the design smaller and using less material. These will all try to be addressed in the next iterations while also trying to print without using supports as described earlier.
The first Amplifi3D design did not amplify sound to the level that was desired. Therefore, a redesign consideration for the next print iterations is to change the path the sound flows through. When evaluating the current Amplifi3D design, the team realized that there was a considerable amount of sound lost due to open spaces and sharp angles throughout the sound flow path, so this will be an improvement focus for the next print iterations. The sound traveled from the speaker through a channel, and was redirected at a 90 degree angle out towards the user. From reviewing the results, it was decided that one of the major changes required for a redesign is reducing the angle between the entrance and exit to the noise channel shown in Figure 16.
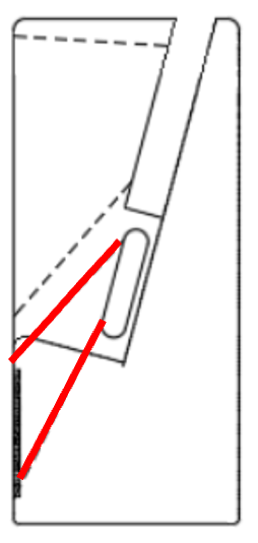
Figure 16: Side view of current channel with the noise channel to be alerted in red.
Reducing the steepness of this angle will provide the sound an easier path out to the user. This is intended to increase the decibel readings in front of the product which is the ultimate goal of the design.
The second redesign consideration concerns the orientation of the phone. The orientation of the phone currently required it to lay on its side. This location prevented the use of the buttons on some phone models and made it harder to interact with the phone while it is in place. The proposed alternative is a vertical phone orientation which allows access to buttons and better user interaction. This change also provides for a more direct connection between the sound connection and the amplification region. One draft of the design change is shown in Figure 17 where the upright phone connects directly to the audio channel which is connected to an amplification area.
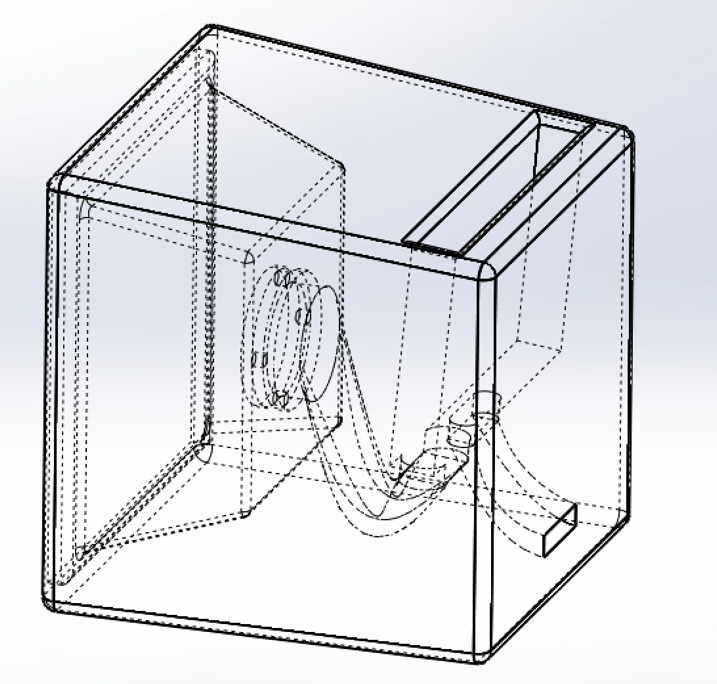
Figure 17: Proposed design with upright phone orientation, and separate audio and charging channels.
The risk with this change is the weight of the phone being at an angle as this could create a moment force on the product and tip the phone. From research, there are methods around this issue, but more detailed considerations about the phone models and rest angle need to be accounted for. Once the phone is able to stand vertically, it will not send audio out of the charging port channel like the current Amplifi3D design.
The final redesign consideration concerns the size and amount of material of the part. The team’s ideal 3D printed passive amplifier is small and compact for several purposes. First, this reduces the print time and cost. Second, a smaller and more compact amplifier will fit in more places, take up less space, and be easier to transport. Third, this means the print can be done on an SLA printer which will produce a higher quality print due to the part being better supported, and the available materials having higher elastic moduli, which is better for the acoustic quality. This redesign consideration was developed by assessing the size, print time, and materials of the first print iteration. Since the current Amplifi3D design took too long on SLA machines, it was made using FFF. This gave a faster print time, however it did not produce the desired quality. In order to build a higher quality amplifier, the amount of material required to print needs to be reduced in order to use SLA. For the current design, this requires removing the support that does not do much for the holding of the phone, an example is shown in Figure 18. By reducing this side material, the part can be printed on an SLA printer. When combined with the adjustment to audio channels, the reduced weight and complexity should redirect audio more effectively while still providing a place for a charger cable.
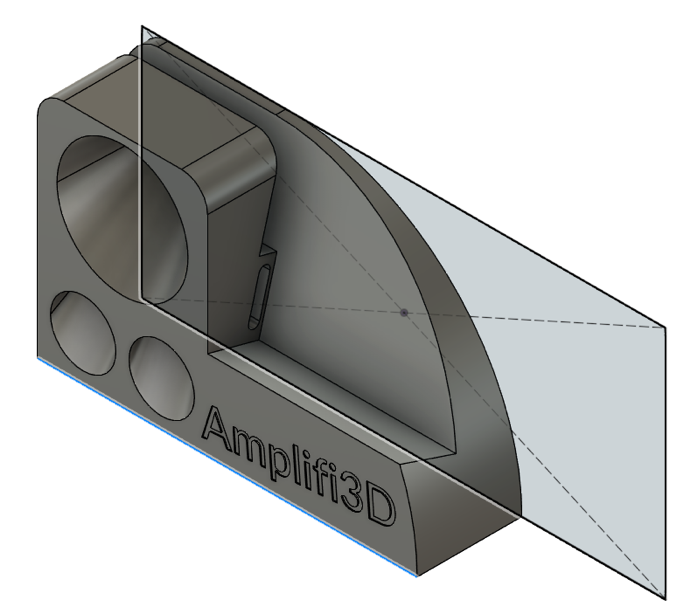
Figure 18. Weight reduction of the original Amplifi3D design with the original footprint shaded behind the new model (new design not yet finalized).
The team will take these data and redesign considerations into account, and will continue to brainstorm and do more print iterations.