WHAT AND WHY:
The team will be using additive manufacturing techniques to iteratively print a passive phone amplifier. Passive amplifiers, also known as mechanical amplifiers, are devices that amplify sound without the use of power. When smartly designed, a passive amplifier for smartphones can be a stylish, cost-effective, and convenient alternative to standard bluetooth or wired speakers. They can be customized for aesthetics, are inexpensive to 3D print, and are convenient to travel with, as they are lightweight and do not require charging. Working off the same acoustic principles as musical instruments, a passive speaker “amplifies” sound by changing the impedance of the air around the speaker to maximize the efficiency of your music player.
One can simply drop their phone into one of these useful devices to amplify the sound from their phone’s built-in speakers. With continued design adjustments and thorough research, we hope to deliver a 3D-printed amplifier with high-quality sound— so you can jam out with style and ease, whether you’re at home or on-the-go!
GOALS:
The goal for the project is to use additive manufacturing techniques to iteratively print and identify the optimal design of an amplifier for mobile phones that:
- Amplifies the phone speaker’s sound by at least 10 dB without power
- Retains or improves the phone speaker’s sound quality
- Securely holds and works with the most popular models of the iPhone and Android
- Allows easy placement and removal of the phone
- Provides a way to charge the phone while the amplifier is being used
- Works in indoor and outdoor settings
- Survives drops/falls up to 4 feet
- Fits and stays in place in small spaces (< 100 in3)
- Functions for at least 500 hours of use
- Stays under the 8 hour print time and cost limit for the project
PLANS:
PRELIMINARY DESIGN:
Preliminary models that fulfill the basic requirements of the product are shown in Figure 1 below. Some aspects of the design goals have not been implemented into the preliminary designs at this time, but will be before the first test print.
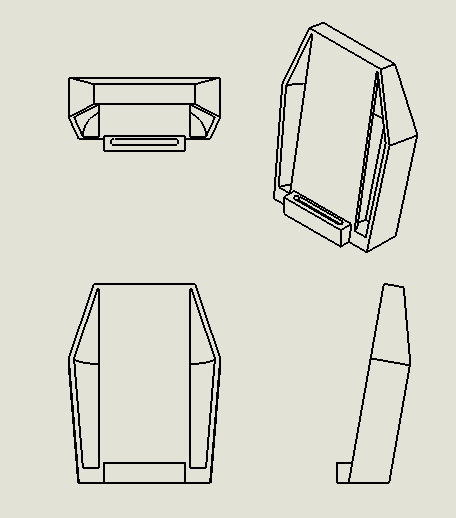
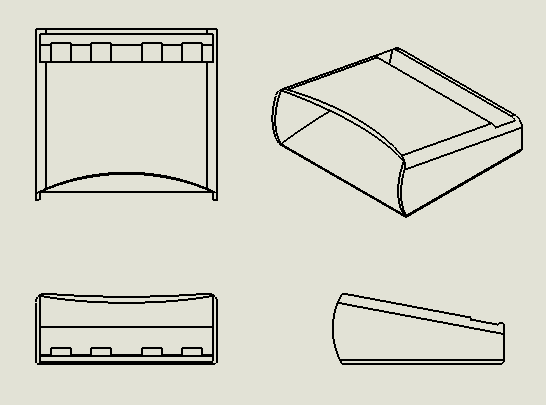
Figure 1: Preliminary designs of Amplifi3D
MATERIALS:
For these experiments, the plan is to use a material optimized for sound quality and amplification that is also able to maintain its structural integrity when housing a range of standard smartphones. To do this, we need to account for the density, elasticity, stiffness, wall-thickness, geometry, and percent in-fill of the 3D printed part. For best acoustic performance, a material with low density, high elasticity, and high stiffness should be chosen, as light materials carry sound vibrations better than dense, heavy objects [1]. The design parameters for wall thickness take into account both structural and acoustic considerations. For structural integrity, it is taken into account that the “Amplifi3D” design may have unsupported walls, i.e. walls that are only connected to another wall on one side. In order to prevent sound waves from leaking out of the walls while traveling through the design, thick enough walls are required to reflect the sound entirely. To withstand impacts of phone placement, the “Amplifi3D” design will need to have a minimum thickness of 2 mm.
Thermoplastics used by Ultimaker and thermosets used by the FormLabs SLA printer were assessed for the “Amplifi3D” design, and the Formlabs “Tough Resin” and “Rigid Resin” were selected as those with the most promising properties. The criteria for evaluating the materials for this application was based on their elasticities, stiffness, and the speed of sound in the material (see Table 1). Elasticity is measured by the elastic modulus, stiffness is proportional to the elastic modulus, and the speed of sound in a material (C) is given by:![]()
Tough Resin and Rigid Resin had both the highest elastic modulus’, and the fastest speed of sound of the materials considered (see Table 1). In choosing in-fill densities, as long as the wall is thick enough to block the transmittance of sound through it, percent in-fill’s are a matter of structural integrity only. An in-fill of 20% is selected as the default for the first print.
| Formlabs Materials [4] | |||
| Density (g/cm^3) | Elastic Modulus (Mpa) | Speed of Sound in Material (m/s) | |
| Draft | 1.020 | 1600 | 39.61 |
| Rigid Resin | 1.260 | 4100 | 57.04 |
| Tough Resin | 1.175 | 2700 | 47.94 |
| Grey Pro | 1.175 | 2600 | 47.04 |
| Clear | 1.175 | 2800 | 48.82 |
| Ultimaker Materials [3] | |||
| Density (g/cm^3) | Elastic Modulus (Mpa) | Speed of Sound in Material (m/s) | |
| PLA | 1.24 | 2346.5 | 43.50 |
| Tough PLA | 1.22 | 1820 | 38.62 |
| Nylon | 1.14 | 579 | 22.54 |
| PC (transparent) | 1.19 | 2134 | 42.35 |
| PC (B & W) | 1.19 | 1904 | 40.00 |
| PVA* | 1.23 | 1700-3600 | 37.17 – 54.10 |
| PP | 0.89 | 220 | 15.72 |
| CPE + | 1.18 | 1128 | 30.92 |
* Support material
Table 1: Properties of various 3D print materials
TESTING:
There are many aspects of this product that could be tested and iterated upon to reach a final design. For the purposes of the project, four main areas have been chosen to test: acoustic amplification, acoustic quality, design utility, and aesthetics. Using the results from these tests after preliminary models are manufactured will help guide subsequent designs towards an overall superior product, and those subsequent designs can be iterated upon using the same tests. Specific protocols for individual tests are outlined in the following sections.
ACOUSTIC AMPLIFICATION TESTING:
The purpose of the product is to divert sound waves that would otherwise be sent away from the user back towards them. The amplification is not actually increasing the amount of energy in the sound wave however it is diverting the energy towards the user. Testing this to benchmark the design versus other methods of amplification will include an unaffected speaker, plastic cup amplifier, and a bluetooth speaker.
Equipment Required:
- Phone
- Decibel meter
- Plastic cup
- Bluetooth speaker
- Audio file
Procedure:
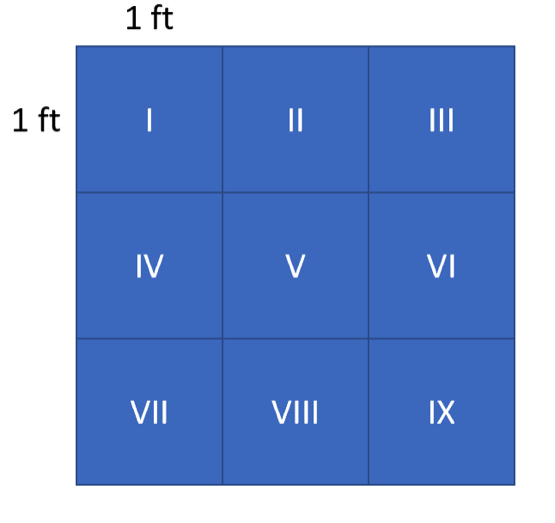
Figure 2: Amplification testing grid
- Create a 3×3 grid of squares with side lengths of 1 foot, as shown in Figure 2.
- For each audio device
- Place audio device in the center of section 5
- Set volume to 25% for a standard sound that has constant sound levels
- Measure the decibel level at the center of each box in the grid
- Record the results on the measurement data sheet
- Repeat measurements with volume set to 50% and 100%
Measurement:
Data will be compiled for each test device and volume level as shown in Table 2.
| Decibel Readings | Audio Device: _______ | Volume Level: _____ % |
| Section 1: ________ dB | Section 2: ________ dB | Section 3: ________ dB |
| Section 4: ________ dB | Section 5: ________ dB | Section 6: ________ dB |
| Section 7: ________ dB | Section 8: ________ dB | Section 9: ________ dB |
Table 2: Amplification test data form
Analysis:
Compare the different effects of varying the volume for each audio device to see how it impacts that decibel scale. Use the differences to evaluate how the product design performs compared to the other devices tested. Create a plot for each device that includes the measurements in each section for the various volume levels. Additionally a plot of all devices for a single noise level may be generated for each tested noise level (examples of both plots are shown in Figure 3).
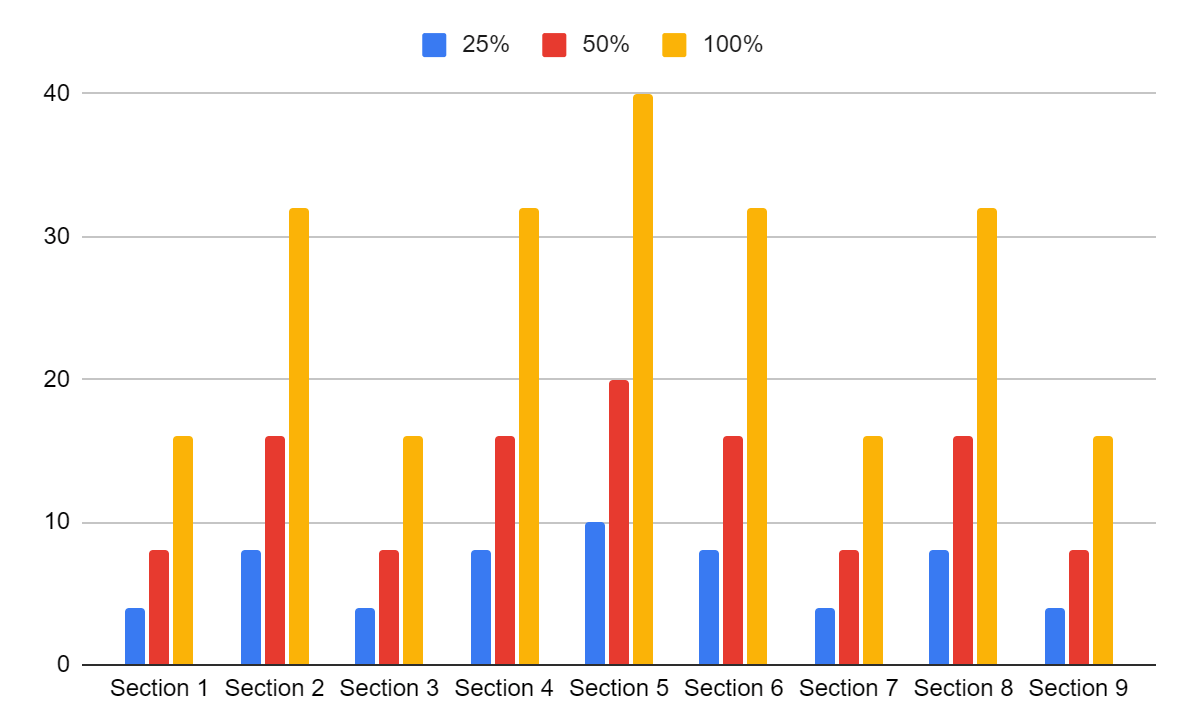
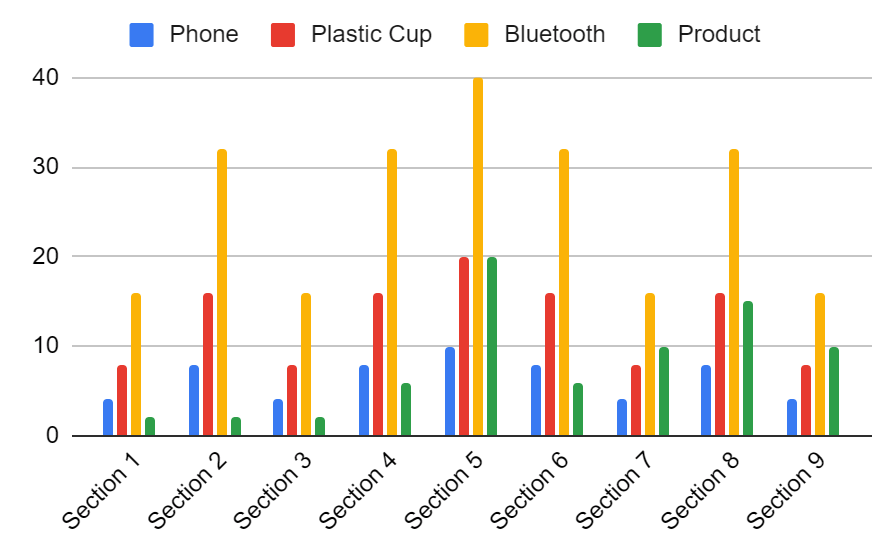
Figure 3: Examples of amplification test plots (values for demonstration purposes)
ACOUSTIC QUALITY TESTING:
The quality is a subjective test of the speaker quality. The goal is to determine if there is any kind of distortion and negative effects to the sound quality by sending audio through the passive amplifier. The test will provide feedback on how the product compares to other sound amplification devices.
Equipment Required:
- Phone
- Plastic cup
- Bluetooth speaker
- Headphones
- Audio file
- Product
- Multiple people
Procedure:
- Play 15 seconds of a song for the individual from each device
- Have the individual give a score to the device from 1-10 with 1 being the lowest and 10 being the highest
- Have the individual rank the different audio devices from best to worst
- Perform the test for all the individuals, with a minimum sample size of five.
Measurement:
Data will be compiled for each user as shown in Table 3.
| Device | User Score (1-10) |
| Speaker only | |
| Plastic cup | |
| Bluetooth speaker | |
| Headphones | |
| Product |
Table 3: Acoustic quality test data form
Analysis:
The product should outperform the speaker on its own and the plastic cup. These are standard methods that the product is designed to outperform. The bluetooth speaker and headphones are designed for quality audio therefore not outperforming those is not a failure of the product. However, being able to compare on the absolute and relative scales will give a sense of the qualitative success of the design.
DESIGN UTILITY & AESTHETICS TESTING:
Design utility will encompass functional aspects of the design that do not involve sound quality or amplification. Design aesthetics will encompass the non-functional aspects of the design, as well as print quality metrics concerning the design, material, and/or manufacturing process. Both of these categories are heavily subjective and will be rated individually per user, who will also rank each sub-category by importance. This test will provide feedback on how to improve parts of the design not having to do with the main purpose (sound amplification).
Equipment:
- Phone
- Product
- Multiple people
Procedure:
- Each tester will rate the product on every metric on a scale of 1-10.
- Each tester will rate every metric based on relative importance to themselves.
- Perform the test for all the individuals, with a minimum sample size of five.
Measurement:
Data will be compiled for each user as shown in Table 4.
| Metric | User Score (1-10) | User Importance (1-10) |
| Securely holds phone | ||
| Easy to insert/remove phone | ||
| Footprint size is satisfactory | ||
| Design aesthetically pleasing without phone installed | ||
| Design aesthetically pleasing with phone installed | ||
| Ease of using charging cable while phone installed | ||
| Product durability (from how it feels in hands) | ||
| Print quality |
Table 4: Design utility and aesthetics test data form
Analysis:
By compiling user scores on every metric weighted by relative importance, a design matrix will be created that will provide valuable feedback on how the design team should most efficiently improve the product with the limited amount of time at their disposal.
REFERENCES:
[1] https://sciencing.com/materials-carry-sound-waves-8342053.html
[2] https://formlabs.com/blog/minimum-wall-thickness-3d-printing/
[3] https://ultimaker.com/materials
[4] https://formlabs.com/materials/standard/